Every construction project distributes its risks (design errors, price overruns, delay) among owner, designer and builder through the contracts they sign. That distribution is fixed before work begins, often without anyone examining it, and it determines how the project behaves when something goes wrong. Choosing a delivery method is choosing a risk allocation: it is the most consequential legal-commercial decision an owner makes, and the least visible one.
The problem
Pure Integrated Project Delivery, meaning a single multi-party agreement with shared risk and reward among owner, designer and constructor, remains concentrated in a small number of mature owner ecosystems, overwhelmingly in California. Outside those markets, and particularly in the Southeast, adoption is marginal. The empirical performance benchmarks are well documented; access to the contractual machinery that produced them is not.
The standard digital practice and multi-party documents acknowledge the need for collaborative governance, but function largely as contractual shells that defer project-specific operational content to separately developed protocols. In markets without deep IPD expertise, those protocols are rarely developed at all. The result is that even projects which nominally select a collaborative method fail at execution, with liability and risk allocation unresolved until someone litigates.
The schedule and the budget are where that failure surfaces. Large projects typically take twenty percent longer to finish than scheduled and run up to eighty percent over budget, per McKinsey’s 2016 analysis of construction’s digital future. Those figures describe ordinary conditions; extreme uncertainty, such as supply chain collapse, labour unavailability or regulatory disruption, tests the delivery structure itself rather than the schedule.
Comparative evidence across delivery methods is hard to assemble because projects differ in scale, type and baseline. Normalising delay across a heterogeneous portfolio, using publicly verifiable disruption records, is what makes the comparison meaningful. It also allows the question to shift from whether a given delay was excusable to which structures reduce exposure to delay in the first place.
What governs this area
- AIA C191Standard form multi-party agreement for Integrated Project Delivery.
- AIA C195 / C197Single purpose entity structures.
- ConsensusDocs 300Standard tri-party collaborative agreement.
- CMARConstruction Manager at Risk. GMP, preconstruction services, risk transfer at buyout.
- Progressive Design-BuildTwo-phase procurement; validation before price commitment.
- Design-AssistTrade contractor engagement during design, without full IPD structure.
- Target Value DesignDesigning to a validated cost rather than estimating a design.
- Uncertainty Schedule Delay IndexNormalised delay measurement across heterogeneous projects.
- Early engagementConstructor and trade input before design is fixed.
- Proactive procurementLong-lead identification and commitment under volatility.
- Lean constructionPull planning, last planner, flow reliability.
The decisions it comes down to
- Which risks are genuinely shared, and which are merely described as shared?
- What triggers the transition from open-book to a committed price?
- How is contingency owned, drawn against, and released?
- What survives completion: warranties, information obligations, dispute mechanisms?
- Which IPD mechanisms can be replicated inside a CMAR or PDB contract, and which cannot?
- How are incentives aligned when a single multi-party agreement is unavailable?
- Which long-lead items dominate schedule exposure, and when must they be committed?
- How early must the constructor be engaged for that input to change the design?
- What does the contract say happens when disruption is neither party's fault?
- How is float owned, and who may consume it?
The evidence behind this area
What a Delivery Method Actually Allocates
Delivery methods get chosen for reasons of habit, procurement law and schedule pressure. What the choice actually does is allocate risk: it fixes who carries the design, who carries the price and from what moment, and who absorbs the coordination failures in between. Then reality stress-tests the allocation. A study I co-authored examined how projects under each of these structures weathered the most severe stress test in recent memory.
1. The instrument, not the philosophy
The owner’s guide literature states the principle plainly: an owner “should strive to assign risks to those parties that can best exercise control over those aspects” (CMAA, 2012), and the level of control the owner retains generally correlates with the level of risk it keeps. The delivery method is the instrument that executes that assignment. In the study this area draws on, we defined it accordingly: the contractual governance structure that defines relationships among owners, designers and constructors: the arrangement that shapes collaboration mechanisms, decision-making processes and risk allocation throughout execution.
Under Design-Bid-Build the owner warrants the design to the builder: it generally faces “exposure to contractor change orders and claims over design and constructibility issues since the owner accepts liability for design in its contract with the contractor” (CMAA, 2012). The price commits at a sealed bid taken on a finished design; there is no constructor in the room while the design decisions are made, and the AIA’s integration guide is blunt about the consequence: of the current models, DBB “offers the least possibility for integration.” Design-Build concentrates design and construction into a single point of accountability and commits the price early, often before design is complete, which relocates the owner’s risk into the document it writes first, since the design criteria it hands the design-builder become the measure of everything delivered afterwards. CMAR keeps design with the owner’s architect and converts the constructor from advisor to at-risk builder at the GMP, negotiated when design is typically fifty to ninety percent developed, which is why the recurring CMAR dispute is over what the builder should have anticipated inside an unfinished design. And a multi-party agreement moves the largest risks into a pool: profit at risk against a jointly validated target, a single shared contingency, and a broad waiver of claims among the signatories.
2. The stress test
Most comparative evidence on delivery methods comes from ordinary conditions. The pandemic years were not ordinary: lockdowns, labour restrictions and supply-chain failure hit every project at once, regardless of what its contract said. With a research team whose senior author directs the Smart Built Environment Eco-System (Smart Bees) Laboratory, I co-authored an exploratory study, published in the Scopus-indexed proceedings of IGLC 34, that compiled seventeen non-residential U.S. projects delivered through that period (2020–2022) across Design-Bid-Build, Design-Build, CMAR and IPD, using only publicly traceable records: FEMA disruption documentation, trade press, owner and institutional reporting, each source graded for reliability. Delay was measured in raw months against the documented baseline, then normalised into an Uncertainty Schedule Delay Index, USDI, scaled from worst (0) to best (1) within each project-complexity group, so that a hospital campus and a school rebuild could be compared without pretending they carry the same baseline.
The descriptive pattern is the one the collaborative-delivery literature would predict: IPD and CMAR projects tended toward shorter delays, Design-Bid-Build toward the longest. The study makes no causal claim from seventeen projects, and says so. The finding that matters here is a different one.
3. The label is not the protection
The most instructive result was the variation inside a single method. Design-Build projects spanned almost the entire index: one with no recorded delay, another ten months late and near the bottom of its group. If the same contractual label can contain both outcomes, the label alone is not a sufficient explanation of resilience. The study’s conclusion states the implication directly: schedule resilience “should not be explained by contract type alone. It should also be understood in relation to project governance and how collaboration actually worked in practice.”
The team interviewed a senior project manager from the best-performing Design-Build project to understand what had gone right. The answer was not the contract form. It was enacted governance: early procurement adjustments when volatility hit, close coordination across the team, fast communication among the key participants. Every one of those is a mechanism a contract can require, resource and enforce, or leave to goodwill. That is precisely the drafting question, and it is the reason this practice area treats delivery method selection and contract drafting as one decision, not two.
4. What transplants, and what does not
The AIA’s own position is that the principles of integrated delivery “can be applied to any delivery model”, with the constructor’s moment of entry as the determining variable. CMAR is “particularly well-suited” to integration because the constructor is already present during preconstruction, and where public procurement requires a bid method it “offers the best potential for approximating fully integrated delivery.” Design-Build standard forms “can be easily modified”: establish a target cost, defer the GMP so early trade involvement can do its work before the price hardens, run open-book accounting, put a portion of profit at risk against measured project goals. Even Design-Bid-Build, which “cannot be integrated,” nonetheless “can be improved.”
What does not transplant is the commercial core of the multi-party agreement, because it presupposes a single contract connecting the parties horizontally: the pooled risk/reward against a target cost, where the members’ profit is collectively the first layer of funding for overruns once contingency is exhausted, a commercial structure under which investing in one trade’s work to harvest a larger saving in another’s becomes rational rather than self-defeating; the single shared contingency, which exists to stop each tier of the supply chain stacking its own; and a broad waiver of claims among signatories, subject to limited exceptions, which frees the initiative otherwise spent on defensive behaviour. Those mechanisms are not clauses to copy; they are the structure itself. A CMAR or Design-Build contract can borrow the behaviours. It cannot borrow the pool.
5. What the full machinery pays
The benchmark for what the complete structure produces remains the UHS Temecula Valley Hospital, delivered under a ConsensusDocs 300 multi-party agreement with Target Value Design and documented by the UC Berkeley Project Production Systems Laboratory: completed at $480 per square foot against a California hospital average of $680, thirty percent below, at roughly $1.1 million per bed against a $1.8 million average, finishing a month and a half ahead of schedule despite eighty-two days of environmental delay, with approximately $16 million saved during design, a further $7 million during construction, and the risk-pool members earning the maximum 150 percent of their negotiated profit. One project, in healthcare, inside California’s mature IPD ecosystem: it is the demonstration of what the machinery can do, not a promise of what any project will get. The work of this practice area is moving as much of that machinery as a given market, procurement regime and risk appetite will carry.
6. The preconstruction window, and the cost of missing it
Behind every number above sits the same clock. The industry has drawn it since 2004 as the MacLeamy curve: the ability to influence cost falls as a project advances while the cost of changing the design rises, and the two lines cross early. The AIA guide states the consequence as a principle: design decisions should move “upstream as far as possible to where they are more effective and less costly.” The window in which planning is cheap and change is still possible is preconstruction, and its cost is trivial against what it controls. The baseline for missing it is documented: large projects across asset classes “typically take 20 percent longer to finish than scheduled and are up to 80 percent over budget” (Agarwal, Chandrasekaran & Sridhar, McKinsey & Company, 2016).
The delivery methods differ precisely in what they let a project do with that window. Design-Bid-Build, by structure, “does not permit early involvement of the constructor in the design process”: the builder arrives when the drawings are finished, influence is spent, and every correction is priced as a change order. CMAR exists largely to buy the window back: the construction manager joins during design with “schedule, budget and constructibility advice,” cost estimates and value engineering while the design can still absorb them, with the guaranteed maximum price usually set “when the design is somewhere between 50 percent and 90 percent developed.” That timing is also where CMAR’s disputes are born: a price fixed on a partial design includes the builder’s estimate of everything not yet drawn, and the parties may remember that estimate differently. The integrated agreement goes furthest, on the premise that “increased effort in planning results in increased efficiency and savings during execution”: not less design effort, but design effort spent while it is still cheap.
7. What the technology changes
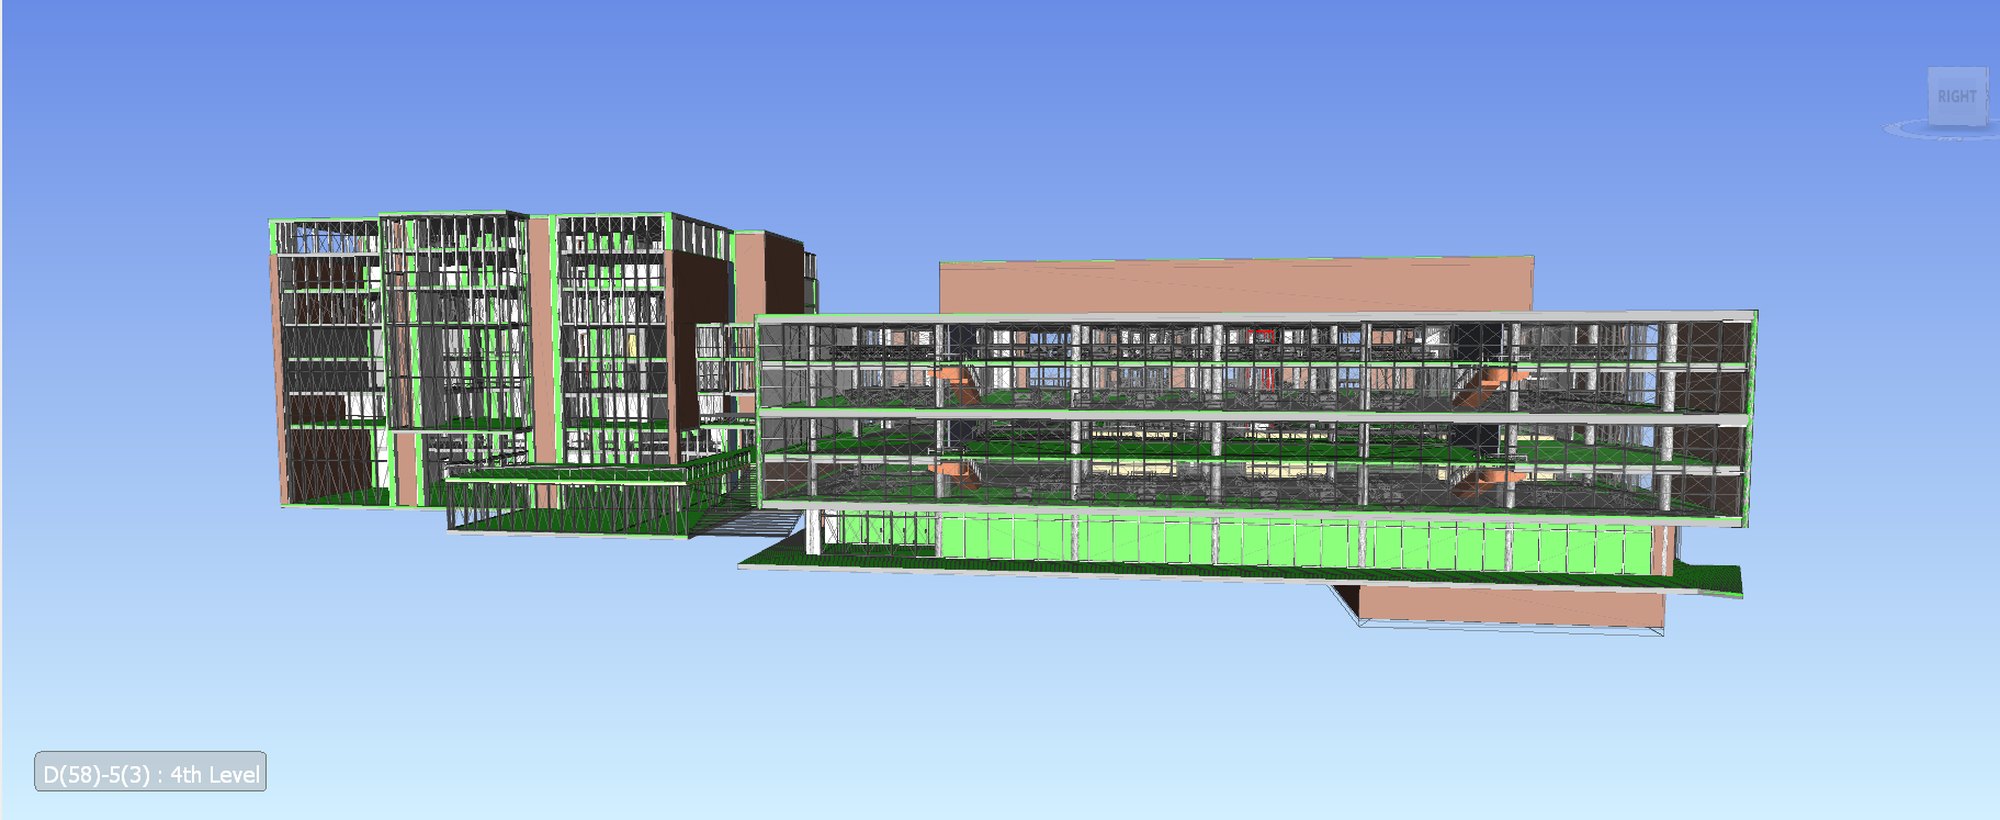
The reason this window can be used harder today than when the curve was drawn is technological. A building information model lets the team “pre-build the project in model form far in advance of actual construction,” price design options while the options are still open, and link cost data directly to the model so decisions are assessed as they are made. The AIA guide is careful about the relationship, and so is this practice: “BIM is a tool, not a project delivery method,” but “the full potential benefits of both IPD and BIM are achieved only when they are used together.” The federated model is what makes the preconstruction window enforceable: clashes resolved before they are built, quantities that keep a target cost honest, and, in Design-Build, a documented reason to defer the GMP so that “model-based decision making” can finish its work before the price hardens.
What is at stake nationally is documented on both sides of the ledger. The National Institute of Standards and Technology put the annual cost of inadequate interoperability in the U.S. capital facilities industry at $15.8 billion in 2002 dollars, roughly two-thirds of it borne by owners and operators: the price of information that does not survive the project, treated in depth in Information Governance. The McKinsey Global Institute estimated a $1.6 trillion annual global productivity opportunity in construction, one-third of it in the United States, where the sector’s labour productivity is lower today than it was in 1968, and named “rewire the contractual framework to reshape industry dynamics” among the seven actions that together could raise sector productivity by 50 to 60 percent. That is the frame in which the AI-era buildout, from hyperscale campuses to federal facilities, is being delivered. The technology is on site; whether the preconstruction window gets used is a governance decision. The through-line of this practice (the contract that opens the window, the model that makes it enforceable, and the digital twin that carries the information into operations) is that discipline.
8. What this evidence does not claim
The study is exploratory and says so in terms: seventeen projects, drawn from public reporting that may be incomplete or selectively disclosed, measured with an index that is a relative normalisation rather than a benchmark, and analysed descriptively: no inferential statistics, no causal claims. It cannot determine whether the observed differences are driven by contract form, by the governance enacted inside it, or by project-specific conditions the public record does not show. That honesty is the point: the study was built to be checked, from sources anyone can trace. The same discipline applies to this page.
Song, J., Esmeral Jaramillo, D., Lu, Y., Eskew, D., Abandoh, C., Nguyen, T., Pishdad, P., & Zeng, Q. (2026). Schedule delay in construction delivery methods under extreme uncertainty. Proceedings of the 34th Annual Conference of the International Group for Lean Construction (IGLC 34), pp. 655–667. DOI 10.24928/2026/0315. Joint work of an eight-author team; I am its second author. Doctrinal sources: CMAA, An Owner’s Guide to Project Delivery Methods (2012); AIA / AIA California Council, Integrated Project Delivery: A Guide (2007), including the CURT WP-1202 (2004) effort curves; Darrington & Lichtig, Integrated Project Delivery (2018); Do, Ballard & Tillmann, UC Berkeley P2SL Temecula Valley Hospital case study (2015); Agarwal, Chandrasekaran & Sridhar, Imagining construction’s digital future (McKinsey & Company, 2016); McKinsey Global Institute, Reinventing Construction (2017); NIST GCR 04-867, Cost Analysis of Inadequate Interoperability in the U.S. Capital Facilities Industry (2004).
Basis
This area rests on more than ten years of Colombian legal practice in contract structuring, risk allocation, corporate governance and dispute resolution, applied to commercial real estate and construction, combined with formal technical training rather than substituting for it. On the schedule side, it rests on co-authorship of Schedule Delay in Construction Delivery Methods Under Extreme Uncertainty (IGLC34 proceedings, pp. 655–667, DOI 10.24928/2026/0315, Scopus-indexed, open access), presented in full in the case on this page.