Value management asks a deceptively simple question before money is spent: what must this thing do, and what is the least it can cost over its whole life to do it well? It is the difference between buying what the project needs and buying what was easiest to specify, and on capital projects that difference is routinely worth millions. On U.S. federal work the discipline is required by law, not recommended.
The problem
The capacity to influence a project's cost collapses as it advances: nearly all of the outcome is determined during the period when the least is known. Decisions taken in weeks of early design govern decades of operating cost, and are effectively irreversible by the time detailed estimates make them visible.
Hyperscale data centres serving artificial intelligence and cloud workloads have become a central driver of new U.S. construction activity and a defining challenge for power infrastructure planning. The capital decisions those projects face, covering generation strategy, storage, grid dependence and resilience, are exactly the class of choice where life-cycle analysis and structured sensitivity testing change the answer, and where an estimate alone does not.
What governs this area
- Target Value DesignDesign to a validated allowable cost, not the reverse.
- Life-cycle cost analysisCapital plus operating cost across the asset's life.
- Sensitivity analysisTesting conclusions across discount rate and benefit scenarios.
- Value engineeringFunction-based analysis, distinct from cost cutting.
- Stakeholder analysisWhose definition of value governs the decision.
- Benefit-cost analysisStructured comparison against a defined baseline.
- ICMSOne international format for presenting construction and life-cycle costs.
The decisions it comes down to
- Whose definition of value governs: owner, operator, occupant, or public?
- What is the allowable cost, validated before design rather than discovered after?
- Over what horizon is life-cycle cost measured, and at what discount rate?
- Which assumptions, if wrong, reverse the conclusion?
- What is the baseline the alternatives are being compared against?
The work behind this area
Value-Engineering the Power Supply of a Hyperscale Data Center
A value engineering study of the highest-leverage capital decision a hyperscale data center makes: where its power comes from. Five configurations, one function, twenty years of life-cycle cost, and a result that contradicts the industry’s default answer. The figures are the computed outputs of a worked reference model of a hyperscale campus in Atlanta, reproduced without embellishment.
1. Why the power system is the value-engineering target
The model’s framing, drawn from the industry references it cites, is direct: in hyperscale construction, electrical systems are the single most expensive component of the build, and once operating, electricity dominates annual expense. Procurement lead times for high-voltage transformers, switchgear and generators can exceed two years, which makes the power decision a schedule decision as well as a cost decision. And the regional context sharpens it: the analysis documents Georgia Power’s projected need for new generation capacity by decade’s end jumping from roughly 400 MW (its 2022 estimate) to 8,500 MW (its 2025 forecast), with data centers expected to account for the large majority of that demand. A megawatt the facility does not draw from the grid is capacity someone else in the region can use.
The national frame is measured, not speculative. Lawrence Berkeley National Laboratory’s 2024 United States Data Center Energy Usage Report, prepared for the Department of Energy, found that U.S. data centers reached “176 TWh by 2023, representing 4.4% of total U.S. electricity consumption,” and projects a range of “roughly 325 and 580 TWh in 2028”: “6.7% to 12.0% of total U.S. electricity consumption forecasted for 2028.” Every one of those facilities is a construction project whose power-infrastructure decision will be made once, early, and lived with for decades. That is what makes the method below a matter of national consequence rather than of one building’s budget. Federal policy has since named the class: Executive Order 14318 (July 2025) designates data centers requiring more than 100 megawatts of new load, or $500 million of investment, as qualifying projects for fast-tracked federal permitting, and the reference model on this page sits at 150 megawatts.
2. Function first, price later
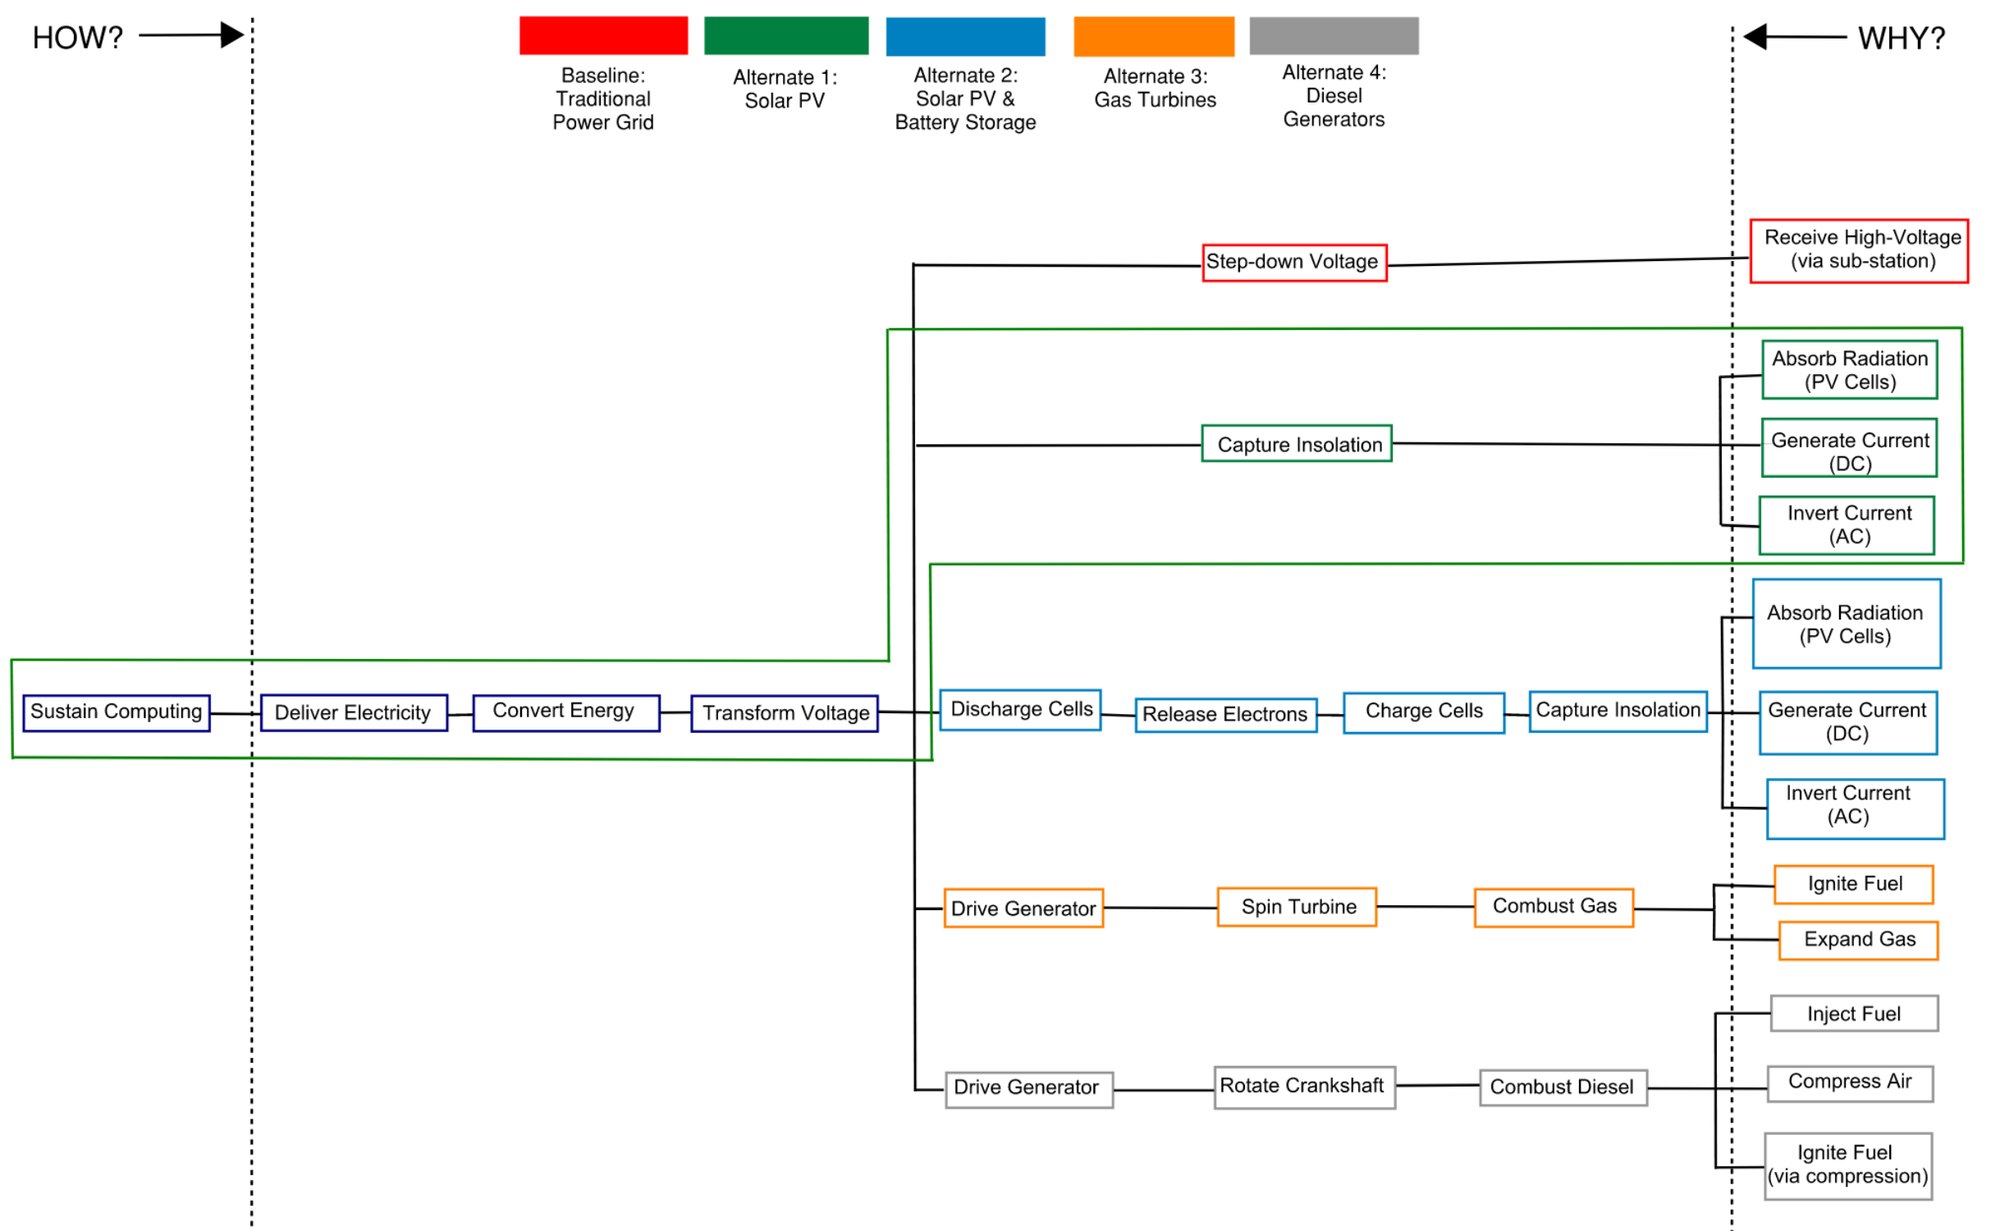
The analysis follows the value methodology sequence: define the functions, then generate alternatives, then, only then, evaluate cost. The primary function is not “buy electricity”; it is deliver continuous, reliable power to the IT load at the lowest life-cycle cost. A Function Analysis System Technique (FAST) diagram linked that function to the means by which a grid-only baseline and four alternatives deliver it: a standalone 150 MW solar array; solar paired with a 200 MW / 800 MWh battery energy storage system; on-site natural gas turbines; and the industry-standard diesel generator fleet.
The order of operations has a birthplace. Value analysis was born of wartime scarcity at General Electric in the 1940s, where Lawrence D. Miles confronted parts that could not be bought and asked the question that became a discipline: what does this part do, and what else would do it? When the substitute performed the function for less, a method was born, established at GE in 1947 and preserved today in the Lawrence D. Miles Value Foundation collection. Nearly eighty years later the question is unchanged; only the part has grown. Here it is a 150-megawatt power system, and “what else would do it” is the whole study.
3. Twenty years, five configurations: explore the results
Each configuration was evaluated as net present worth over twenty years at the model’s 8.2 percent weighted average cost of capital, with single-variable sensitivity on discount rate, benefit realization and service life. The mathematics is the standard present-worth method of the engineering-economics literature (the reference text is Newnan, Eschenbach, Lavelle & Lewis, Engineering Economic Analysis, 14th ed., Oxford University Press, 2019): every future dollar of cost or saving is converted to its value today, so alternatives with different lives and different spending shapes can be compared on one number. The explorer below navigates the model’s computed tables: it interpolates nothing.
Net present worth in millions of 2026 dollars, relative to the grid-only baseline. Values are the model’s computed results; nothing here is interpolated. A worked reference model, not a live project.
4. What the numbers teach, beyond this building
Three results carry past the case. First, the winner was not the cheapest option: it was the most expensive one. Solar with storage requires the highest initial capital of the five configurations and still returns the highest net present worth in the base case, because a one-time federal investment tax credit, avoided electricity purchases and grid-services revenue compound over twenty years. First cost is not value; the analysis exists to show the difference. Second, the industry default failed the function test. Diesel generators, the standard hyperscale backup, sit idle roughly 99 percent of their lifespan while demanding continuous maintenance, and were formally rejected: battery discharge answers the same backup function in milliseconds, with no fuel logistics. Gas turbines were rejected on a subtler ground: they replicate inside the fence exactly the fuel-price volatility the project was trying to escape: the function delivered did not match the function required. Third, the honest variable is the discount rate: a two-point shift materially narrows the gap between the leading alternatives, which is why the analysis reports it as the single most important number to monitor, and why this practice treats sensitivity testing as part of the deliverable rather than an appendix.
5. On public work, the method is not optional
Value engineering is not a private-sector refinement; on U.S. federal work it is statute. Title 41 of the U.S. Code, §1711: “Each executive agency shall establish and maintain cost-effective procedures and processes for analyzing the functions of a program, project, system, product, item of equipment, building, facility, service, or supply of the agency,” with the analysis “directed at improving performance, reliability, quality, safety, and life cycle costs.” OMB Circular A-131 (revised 2013) operationalises the mandate: “Federal agencies shall consider and use VE as a management tool,” and VE “shall be required for new agency projects and programs when the project cost estimate is at least $5 million.” The discipline this practice applies (function analysis by a multidisciplinary team, in the tradition stewarded since 1959 by what is today SAVE International) is the same one federal law expects of every agency that builds at scale. And it is a standardised discipline, not a style: SAVE’s current Value Methodology follows an eight-phase job plan (preparation, information, function analysis, creativity, evaluation, development, presentation, implementation), with studies led by facilitators certified against it.
The same mathematics also decides who gets federal money. The U.S. Department of Transportation’s Benefit-Cost Analysis Guidance for Discretionary Grant Programs (December 2025) sets, per OMB Circular A-94, a real discount rate of 7 percent per year for the benefit-cost analyses that accompany grant applications: every stream of benefits and costs brought to present value before a project competes. Present worth, sensitivity and a defensible discount rate are not an academic ornament in this chapter; they are the arithmetic in which the federal government conducts the competition. And the presentation of cost itself now has an international standard: ICMS, the International Cost Management Standard, published by a coalition of 49 professional bodies, whose current edition (November 2021) puts construction cost, life-cycle cost and carbon in one comparable format. Showing the work, in a form others can check, is no longer optional either.
6. What this case does and does not claim
This is a worked reference model, not a client engagement: a hyperscale campus with a defined capital stack, evaluated against published cost references with single-variable sensitivity. What it demonstrates is the discipline this area sells: function analysis before pricing, life-cycle cost before first cost, sensitivity before certainty, and a recommendation that names the conditions under which it stops being right. The figures shown are the model’s computed outputs, reproduced exactly; where its framing figures come from industry references, they are presented as such, not as independent findings of this site.
A twenty-year life-cycle model of hyperscale power supply, developed with a seven-member project team; the author of this site is one of them. Methodology following the value methodology’s job plan through its study phases: information, function analysis (FAST), creativity, evaluation (net present worth at the model’s 8.2% WACC), development.
Basis
A life-cycle evaluation of power infrastructure for hyperscale data centres, developed with a project team: four supply alternatives (solar photovoltaic, solar with battery energy storage, on-site natural gas turbines, and traditional diesel generation) compared against a grid-only baseline on net present worth, with sensitivity testing across discount-rate and benefit scenarios and structured stakeholder analysis. Presented in full in the case on this page.